> ## Documentation Index
> Fetch the complete documentation index at: https://docs.msportal.ai/llms.txt
> Use this file to discover all available pages before exploring further.
# Read and filter a dashboard
> Choose a dashboard, check company scope, understand date ranges, and adjust the display.
Open **Dashboards** to review the charts and summary cards available to you. Start by checking the dashboard title, selected company, and dates shown on each chart.
**Audience:** Company users with dashboard access and MSP staff reading dashboard data. Dashboard access does not automatically grant access to every underlying module or record.
## Find the right dashboard
1. Open **Dashboards** from the main navigation.
2. Use the narrow dashboard icon rail to switch dashboards. Hover over an icon to see its name. The outlined icon identifies the dashboard currently open, not necessarily the configured default.
3. Check the title and description before comparing metrics. Your MSP can provide shared dashboards, while authorized users can also have personal dashboards.
Opening Dashboards can take you directly to an available default or first dashboard. The portal can also remember the last dashboard you visited for navigation. A saved link may lead elsewhere if that dashboard is no longer available.
System dashboards can include **Ticketing Dashboard** and **Risk Dashboard**. The widgets depend on the dashboard configuration, your permissions, connected integrations, and available data for the selected companies. Not every dashboard has ticket summary cards.
## Choose company scope
If your portal provides a company selector, choose the company or permitted group of companies before reading the results. Wait for the charts to finish loading. A company-specific view can have fewer widgets and records than an MSP global view.
An empty chart can mean there are no matching records for the selected company and period. It does not prove that all work is complete or that an integration is healthy. Check the company, widget dates, access and source module before drawing that conclusion.
## Change the displayed dates
Select **Widget Defaults** or the current date label in the header, then choose a preset:
| Preset | How to interpret it |
| -------------------------------------------------------- | ------------------------------------------------------------------------------------------------------------------------- |
| **Widget Defaults** | Return to the viewer default. Always check each chart’s printed dates; configured widget overrides can use another range. |
| **This Week** | The current Sunday-to-Saturday week. |
| **Previous Week** | The preceding Sunday-to-Saturday week. |
| **Previous 2 Weeks** | The two complete weeks before the current week. |
| **Last 30 days** | A rolling 30-day range. |
| **Last 3 months**, **Last 6 months**, **Last 12 months** | From the first day of the month that many months ago through now; these are not fixed 90-, 180-, or 365-day windows. |
| **All Time** | The broad available-data view, subject to the source’s retained history. |
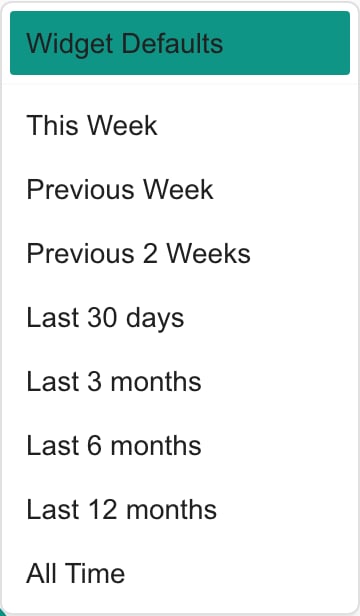 The header menu does not offer a custom start/end date picker. Date-aware widgets use the selected range unless their own configured date override takes precedence. Current-state widgets may not use a date range at all.
Ticket summary cards keep their own current or rolling-month windows. Changing the chart date menu does not change those card windows. Read the card label and chart dates separately.
## Adjust widget width
Use the width button beside the date menu to cycle through **½**, **⅓**, and **¼**. These arrange widgets in two, three, or four columns when space permits. Wider widgets can make labels easier to read.
The header menu does not offer a custom start/end date picker. Date-aware widgets use the selected range unless their own configured date override takes precedence. Current-state widgets may not use a date range at all.
Ticket summary cards keep their own current or rolling-month windows. Changing the chart date menu does not change those card windows. Read the card label and chart dates separately.
## Adjust widget width
Use the width button beside the date menu to cycle through **½**, **⅓**, and **¼**. These arrange widgets in two, three, or four columns when space permits. Wider widgets can make labels easier to read.
 Date and width controls change the current view. They do not save a new shared dashboard layout or modify the underlying tickets, risks, or other records. Permanent layout changes use the dashboard editor and its Save action, when you have access.
## Understand missing controls or data
| What you see | What to check |
| ------------------------------------- | ------------------------------------------------------------------------------------------------------------------------------------------------------- |
| No dashboards available | Ask the MSP to check dashboard access, active/shared status, role restrictions and Company visibility. |
| A dashboard is missing | Personal dashboards belong to their owner; shared dashboards may be restricted. Internal-only dashboards are unavailable to Company users. |
| A widget is missing | Its module permission, integration availability, selected-company data and saved dashboard configuration. |
| No Edit button | System dashboards are not edited through the normal reader; custom-dashboard editing requires the applicable access. Ask the MSP if a change is needed. |
| Loading or an error | Wait for loading to finish; an error is not a zero result. Record the dashboard, company, date selection and message for the MSP. |
| Different numbers from another person | Compare dashboard, company scope, role visibility, date windows and exclusions before comparing totals. |
Company administrators ask the MSP to change user permissions. Do not use a direct dashboard link as a way to bypass access restrictions.
## Related guides
* [Inspect tickets behind a dashboard metric](/user-guides/dashboards/inspect-dashboard-tickets)
* [Export a dashboard to PDF](/user-guides/dashboards/export-dashboard)
* [Understand your role and company access](/user-guides/account/understand-your-access)
For missing submitters, ticket types or recurring tickets, see [Understand dashboard exclusions](/user-guides/dashboards/understand-dashboard-exclusions). MSP staff can [configure exclusions](/user-guides/dashboards/configure-dashboard-exclusions) in Settings > Dashboards > Exclusions.
## Frequently asked questions
Open Dashboards and use the dashboard icon rail. Hover an icon to identify it and check the page title after switching.
It marks the dashboard currently open. It is not proof of the configured default.
The portal can use an available default or first dashboard, and navigation can remember your last visit. A previously saved dashboard may no longer be available.
Company access, role visibility, selected companies, integrations and dashboard configuration can differ. MSP global views can contain more data.
Summary cards appear only when configured. Risk and other dashboards can use different widgets.
No. Date-aware charts use the selected range unless a widget override takes precedence. Current-state widgets and fixed-window summary cards can keep their own periods.
The current header offers presets, not a custom start/end date picker.
No. The chart preset starts on the first day of the month three months ago and ends now. Check the dates printed on the chart.
It returns to the viewer default. Read each widget’s displayed dates because a configured override can take precedence; do not assume every widget uses a separately saved legacy date preset.
It cycles through half, third and quarter widths for the current view. It does not save a shared dashboard layout.
No. Reader date, company and display controls change what you view. Record changes happen in the relevant module or authorized editor.
No. Check company scope, dates, permissions, integration availability and loading errors. Empty results are not proof of a healthy environment.
No. Ask the MSP for a dashboard intended for Company users. A direct link does not grant access.
Ask the MSP to change user permissions or the dashboard’s access settings.
The system dashboard cannot be edited through the normal reader. Editing a custom dashboard requires the applicable access; ask the MSP for a configuration change if needed.
Date and width controls change the current view. They do not save a new shared dashboard layout or modify the underlying tickets, risks, or other records. Permanent layout changes use the dashboard editor and its Save action, when you have access.
## Understand missing controls or data
| What you see | What to check |
| ------------------------------------- | ------------------------------------------------------------------------------------------------------------------------------------------------------- |
| No dashboards available | Ask the MSP to check dashboard access, active/shared status, role restrictions and Company visibility. |
| A dashboard is missing | Personal dashboards belong to their owner; shared dashboards may be restricted. Internal-only dashboards are unavailable to Company users. |
| A widget is missing | Its module permission, integration availability, selected-company data and saved dashboard configuration. |
| No Edit button | System dashboards are not edited through the normal reader; custom-dashboard editing requires the applicable access. Ask the MSP if a change is needed. |
| Loading or an error | Wait for loading to finish; an error is not a zero result. Record the dashboard, company, date selection and message for the MSP. |
| Different numbers from another person | Compare dashboard, company scope, role visibility, date windows and exclusions before comparing totals. |
Company administrators ask the MSP to change user permissions. Do not use a direct dashboard link as a way to bypass access restrictions.
## Related guides
* [Inspect tickets behind a dashboard metric](/user-guides/dashboards/inspect-dashboard-tickets)
* [Export a dashboard to PDF](/user-guides/dashboards/export-dashboard)
* [Understand your role and company access](/user-guides/account/understand-your-access)
For missing submitters, ticket types or recurring tickets, see [Understand dashboard exclusions](/user-guides/dashboards/understand-dashboard-exclusions). MSP staff can [configure exclusions](/user-guides/dashboards/configure-dashboard-exclusions) in Settings > Dashboards > Exclusions.
## Frequently asked questions
Open Dashboards and use the dashboard icon rail. Hover an icon to identify it and check the page title after switching.
It marks the dashboard currently open. It is not proof of the configured default.
The portal can use an available default or first dashboard, and navigation can remember your last visit. A previously saved dashboard may no longer be available.
Company access, role visibility, selected companies, integrations and dashboard configuration can differ. MSP global views can contain more data.
Summary cards appear only when configured. Risk and other dashboards can use different widgets.
No. Date-aware charts use the selected range unless a widget override takes precedence. Current-state widgets and fixed-window summary cards can keep their own periods.
The current header offers presets, not a custom start/end date picker.
No. The chart preset starts on the first day of the month three months ago and ends now. Check the dates printed on the chart.
It returns to the viewer default. Read each widget’s displayed dates because a configured override can take precedence; do not assume every widget uses a separately saved legacy date preset.
It cycles through half, third and quarter widths for the current view. It does not save a shared dashboard layout.
No. Reader date, company and display controls change what you view. Record changes happen in the relevant module or authorized editor.
No. Check company scope, dates, permissions, integration availability and loading errors. Empty results are not proof of a healthy environment.
No. Ask the MSP for a dashboard intended for Company users. A direct link does not grant access.
Ask the MSP to change user permissions or the dashboard’s access settings.
The system dashboard cannot be edited through the normal reader. Editing a custom dashboard requires the applicable access; ask the MSP for a configuration change if needed.