> ## Documentation Index
> Fetch the complete documentation index at: https://docs.msportal.ai/llms.txt
> Use this file to discover all available pages before exploring further.
# Read and export Planner Analytics
> Choose the analysis scope, interpret the summary figures and export matching Planner data.
**Audience:** Company users with Planner read access and MSP staff. Company users see permitted client-visible work; the MSP manages access.
Open **Planner Menu > Analytics** to review planned work. Analytics uses Planner estimates, dates, status and probability. It does not verify invoices, approved budgets, actual time, delivered services or financial results.
## Choose what to analyze
1. Check the portal's company scope.
2. Choose the **Currency**. If the scope contains several currencies, Analytics analyzes one at a time; it does not convert and combine them.
3. Choose **Cost type**: One-time, Monthly or Annual.
4. Choose **Current Q**, **Next Q**, **This Year**, **Next Year** or **All Time**.
5. Use **All Status** and **All Types**, or select the status and type you need.
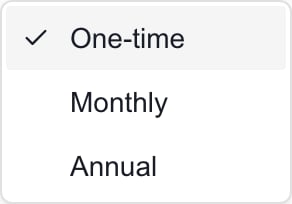 The initial view uses **One-time**, **Current Q**, All Status and All Types. When several currencies are available, the first available currency is selected; confirm it before reading the totals.
The period filter uses the **due date**. Items without a due date are excluded from quarter/year filters; use All Time to include them. The current quarter/year is based on the tenant's configured timezone.
Cost type changes the amounts used in the analysis. It does not remove an item just because it has no cost in that cadence. For example, a work item with only a monthly cost can still contribute hours and status counts when One-time is selected, while contributing zero One-time cost. Selecting a quarter does not multiply a monthly cost by three. Timeline **Project Recurring Costs** is a separate projection control.
## Read the headline figures
| Figure | Meaning |
| ------------------- | -------------------------------------------------------------------------------------------------------------------------------------------------------------------- |
| **Expected Value** | Selected cost multiplied by probability for unfinished work; Completed contributes its full selected cost, Cancelled contributes zero. Missing probability uses 50%. |
| **Completion Rate** | Business Value-weighted completion, excluding Cancelled. High weighs 3, Medium 2, and Low/other values 1. |
| **Total Hours** | Sum of the filtered items' estimated hours. This is not recorded technician time. |
| **Avg Probability** | Average probability for work other than Completed and Cancelled, using 50% when unset. When no such work remains, it displays 100%. |
A 100% Avg Probability with only finished/cancelled work is the display fallback, not a forecast for future work. Different panels can exclude Cancelled or Completed items differently; see [Understand Planner Analytics charts](/user-guides/planner/understand-analytics-charts).
For an unfinished item with selected cost 1,000 and probability 40%, Expected Value is 400. Marking it Completed makes that contribution 1,000; Cancelled makes it zero. These rules describe a planning calculation, not a recognized revenue or payment event.
## Explore Dashboard and Pipeline
**Dashboard** contains Project Health Score, Risk Matrix, expected-value charts and High Risk Items. **Pipeline** contains Status Pipeline, Resource Allocation and Client Commitment Tracker.
Select a category, chart bar, pipeline stage, resource cell or company card to narrow the analysis to matching work. A High Risk Items title narrows to that item; it does not open the editor. The summary figures and export follow the narrowed dataset.
Use **Clear** to remove this chart selection. It does not reset Currency, Cost type, period, Status, Type or portal company scope. If a selection returns no results, **Clear Filter** removes it from the empty state. A new chart selection replaces the previous chart selection while retaining the toolbar filters. Changing company scope clears the chart selection.
## Export matching data
1. Choose the company scope, currency, cost type, period, status and type.
2. Clear any chart selection you do not want in the export.
3. Select **Export** and locate the downloaded CSV in your browser's downloads.
4. Check the exported rows and the currency/cost-type columns before using the file.
The CSV contains Title, Status, Type, Business Value, Cost Estimate, Probability, Expected Value, Hours, Due Date, Company, **ISO 4217** currency code and Cost type. Cost Estimate is the sum for the selected cadence, not every cost row attached to the item. Expected Value follows the same Completed/Cancelled/probability rules as the summary.
Export includes the current Analytics dataset, including an active chart selection. It is not a screenshot/PDF of the charts, an export of archived work, or an export of the filters from List View. An empty analysis can produce only column headings.
## Troubleshoot missing or unexpected results
* Choose the intended currency and cadence before comparing amounts.
* Switch to All Time when looking for work outside the current quarter or without a due date.
* Remove Status, Type and chart restrictions as needed.
* Archived items are outside the normal Analytics dataset; use [List View](/user-guides/planner/find-planner-items) to inspect them.
* A loading error means the analysis may be incomplete. Reload or contact the MSP; do not interpret an error as zero work.
## FAQs
Open Planner Menu > Analytics. Planner read access and Company item visibility determine the available work.
Analytics selects one currency at a time. Choose another Currency to analyze those companies; amounts are not converted into one combined total.
Cost type selects the cadence to sum. Choose Monthly for monthly costs or Annual for annual costs.
No. The period restricts items by due date; cost type selects their cadence amounts. Timeline recurring projection is a separate feature.
Items without a cost in the selected cadence still contribute counts and estimated hours.
Choose All Time. Quarter and year filters exclude undated work.
Unfinished work uses selected cost times probability, defaulting to 50% if unset. Completed contributes full selected cost; Cancelled contributes zero.
It weights High Business Value by 3, Medium by 2 and Low/other by 1, excluding Cancelled items.
No. It sums Planner estimated hours for the current filtered dataset.
That is the fallback when all remaining items are Completed or Cancelled. It is not a prediction of future success.
It narrows the Analytics dataset, summary figures and CSV export. It does not edit an item.
No. It clears only the chart selection. Currency, cost type, period, status, type and company scope remain.
Yes. Select Export after choosing the analysis filters. The file includes matching item rows, selected-cadence costs, expected value, hours, currency and cost type.
No. Analytics uses its own dataset and filters, including the active chart selection. It does not inherit List View filters or include archived work.
The initial view uses **One-time**, **Current Q**, All Status and All Types. When several currencies are available, the first available currency is selected; confirm it before reading the totals.
The period filter uses the **due date**. Items without a due date are excluded from quarter/year filters; use All Time to include them. The current quarter/year is based on the tenant's configured timezone.
Cost type changes the amounts used in the analysis. It does not remove an item just because it has no cost in that cadence. For example, a work item with only a monthly cost can still contribute hours and status counts when One-time is selected, while contributing zero One-time cost. Selecting a quarter does not multiply a monthly cost by three. Timeline **Project Recurring Costs** is a separate projection control.
## Read the headline figures
| Figure | Meaning |
| ------------------- | -------------------------------------------------------------------------------------------------------------------------------------------------------------------- |
| **Expected Value** | Selected cost multiplied by probability for unfinished work; Completed contributes its full selected cost, Cancelled contributes zero. Missing probability uses 50%. |
| **Completion Rate** | Business Value-weighted completion, excluding Cancelled. High weighs 3, Medium 2, and Low/other values 1. |
| **Total Hours** | Sum of the filtered items' estimated hours. This is not recorded technician time. |
| **Avg Probability** | Average probability for work other than Completed and Cancelled, using 50% when unset. When no such work remains, it displays 100%. |
A 100% Avg Probability with only finished/cancelled work is the display fallback, not a forecast for future work. Different panels can exclude Cancelled or Completed items differently; see [Understand Planner Analytics charts](/user-guides/planner/understand-analytics-charts).
For an unfinished item with selected cost 1,000 and probability 40%, Expected Value is 400. Marking it Completed makes that contribution 1,000; Cancelled makes it zero. These rules describe a planning calculation, not a recognized revenue or payment event.
## Explore Dashboard and Pipeline
**Dashboard** contains Project Health Score, Risk Matrix, expected-value charts and High Risk Items. **Pipeline** contains Status Pipeline, Resource Allocation and Client Commitment Tracker.
Select a category, chart bar, pipeline stage, resource cell or company card to narrow the analysis to matching work. A High Risk Items title narrows to that item; it does not open the editor. The summary figures and export follow the narrowed dataset.
Use **Clear** to remove this chart selection. It does not reset Currency, Cost type, period, Status, Type or portal company scope. If a selection returns no results, **Clear Filter** removes it from the empty state. A new chart selection replaces the previous chart selection while retaining the toolbar filters. Changing company scope clears the chart selection.
## Export matching data
1. Choose the company scope, currency, cost type, period, status and type.
2. Clear any chart selection you do not want in the export.
3. Select **Export** and locate the downloaded CSV in your browser's downloads.
4. Check the exported rows and the currency/cost-type columns before using the file.
The CSV contains Title, Status, Type, Business Value, Cost Estimate, Probability, Expected Value, Hours, Due Date, Company, **ISO 4217** currency code and Cost type. Cost Estimate is the sum for the selected cadence, not every cost row attached to the item. Expected Value follows the same Completed/Cancelled/probability rules as the summary.
Export includes the current Analytics dataset, including an active chart selection. It is not a screenshot/PDF of the charts, an export of archived work, or an export of the filters from List View. An empty analysis can produce only column headings.
## Troubleshoot missing or unexpected results
* Choose the intended currency and cadence before comparing amounts.
* Switch to All Time when looking for work outside the current quarter or without a due date.
* Remove Status, Type and chart restrictions as needed.
* Archived items are outside the normal Analytics dataset; use [List View](/user-guides/planner/find-planner-items) to inspect them.
* A loading error means the analysis may be incomplete. Reload or contact the MSP; do not interpret an error as zero work.
## FAQs
Open Planner Menu > Analytics. Planner read access and Company item visibility determine the available work.
Analytics selects one currency at a time. Choose another Currency to analyze those companies; amounts are not converted into one combined total.
Cost type selects the cadence to sum. Choose Monthly for monthly costs or Annual for annual costs.
No. The period restricts items by due date; cost type selects their cadence amounts. Timeline recurring projection is a separate feature.
Items without a cost in the selected cadence still contribute counts and estimated hours.
Choose All Time. Quarter and year filters exclude undated work.
Unfinished work uses selected cost times probability, defaulting to 50% if unset. Completed contributes full selected cost; Cancelled contributes zero.
It weights High Business Value by 3, Medium by 2 and Low/other by 1, excluding Cancelled items.
No. It sums Planner estimated hours for the current filtered dataset.
That is the fallback when all remaining items are Completed or Cancelled. It is not a prediction of future success.
It narrows the Analytics dataset, summary figures and CSV export. It does not edit an item.
No. It clears only the chart selection. Currency, cost type, period, status, type and company scope remain.
Yes. Select Export after choosing the analysis filters. The file includes matching item rows, selected-cadence costs, expected value, hours, currency and cost type.
No. Analytics uses its own dataset and filters, including the active chart selection. It does not inherit List View filters or include archived work.