Accessing Reports
- Click Reporting in the sidebar
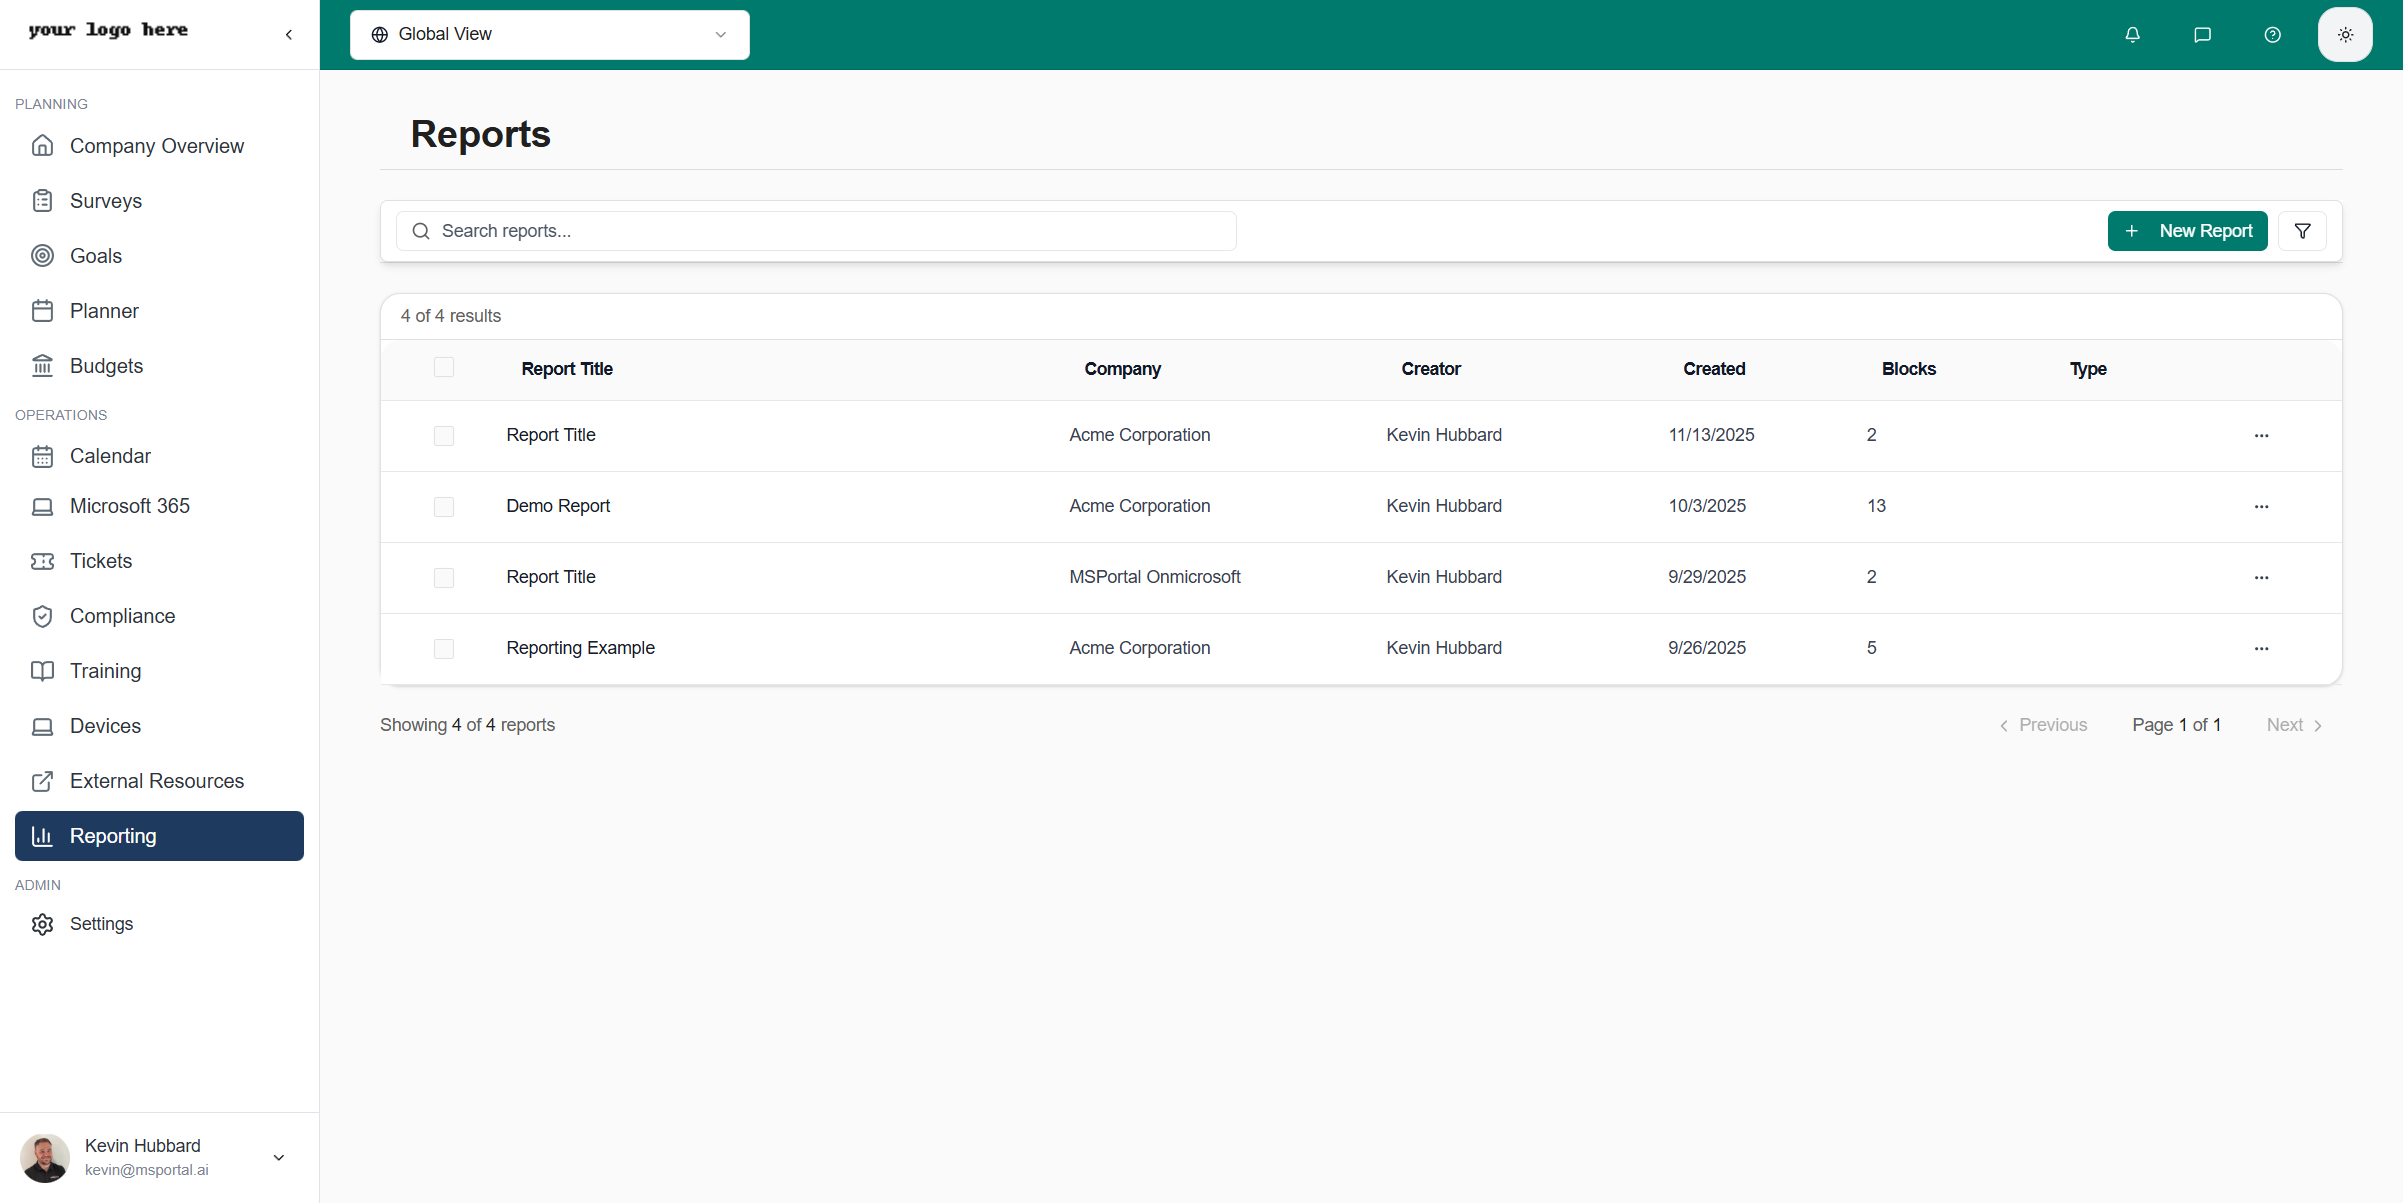
- The reports list displays all your saved reports
Reports List
Reports Table
The reports table displays:| Column | Description |
|---|---|
| Report Title | Name of the report |
| Company | Associated company |
| Creator | User who created the report |
| Created | Creation date |
| Blocks | Number of content blocks in the report |
| Type | Report category (Quarterly Report, etc.) |
| Actions | Edit, duplicate, delete options |
Filtering and Search
- Search - Find reports by title
- Filter - Click the filter icon to narrow results
- Sort - Click column headers to sort
Viewing a Report
Click any report to view its contents: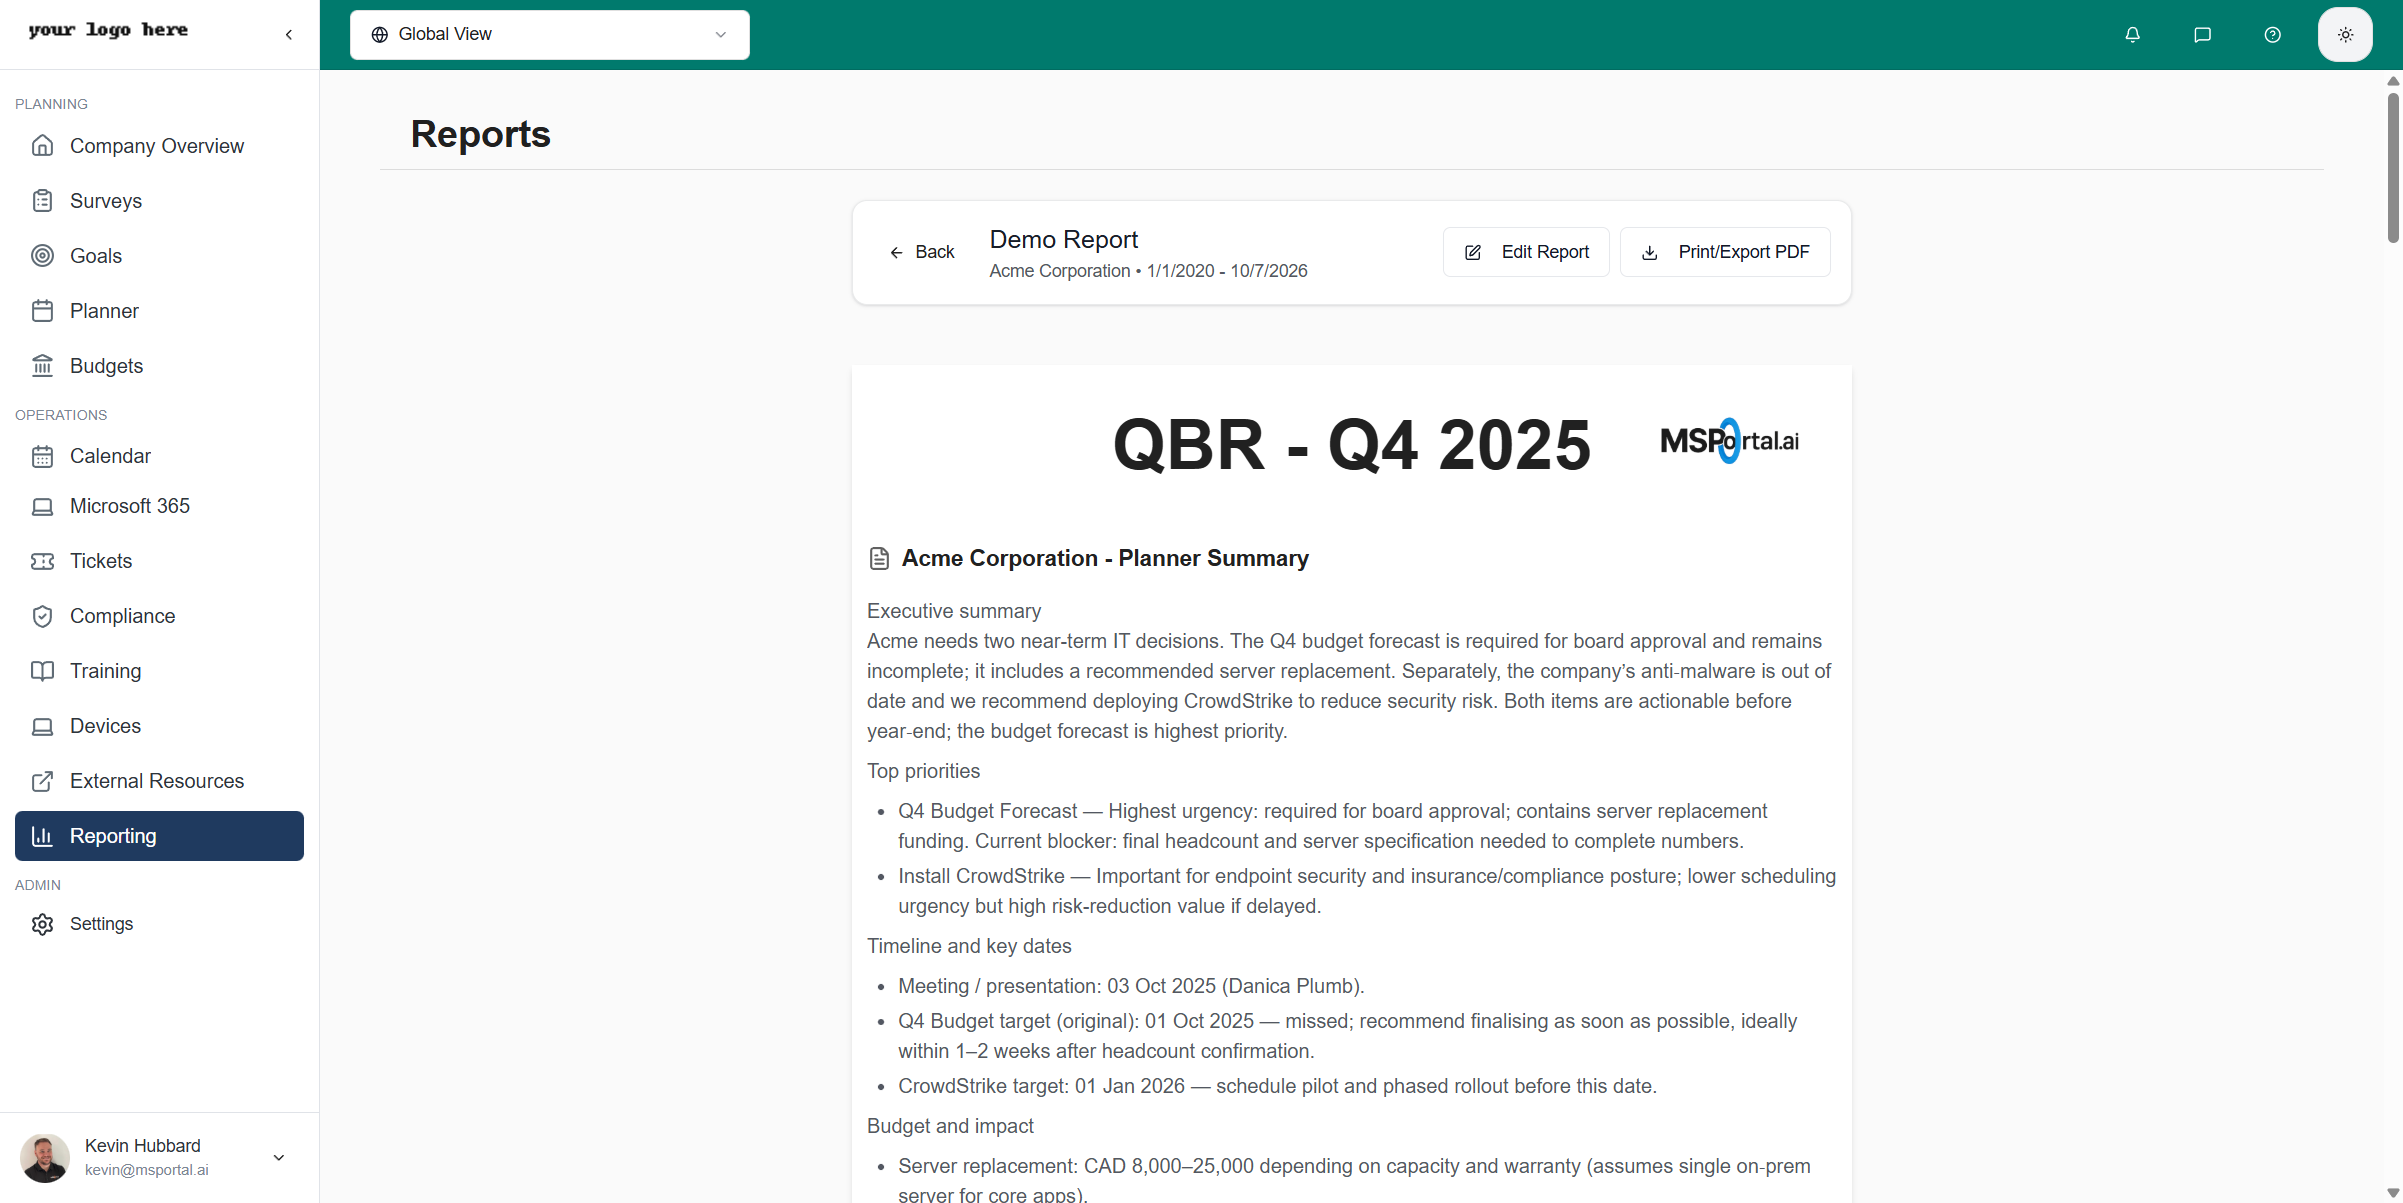
Report Header
| Element | Description |
|---|---|
| Back | Return to reports list |
| Title | Report name and company |
| Date Range | Data period covered |
| Edit Report | Open in report builder |
| Print/Export PDF | Generate PDF for sharing |
Report Content
Reports display content blocks in a paginated format:- Text blocks - Headings, paragraphs, AI-generated summaries
- Data blocks - Charts, tables, metrics from MSPortal modules
- Branding - Company logos and styling
Creating a New Report
Report Builder
The report builder provides a visual editor for creating reports: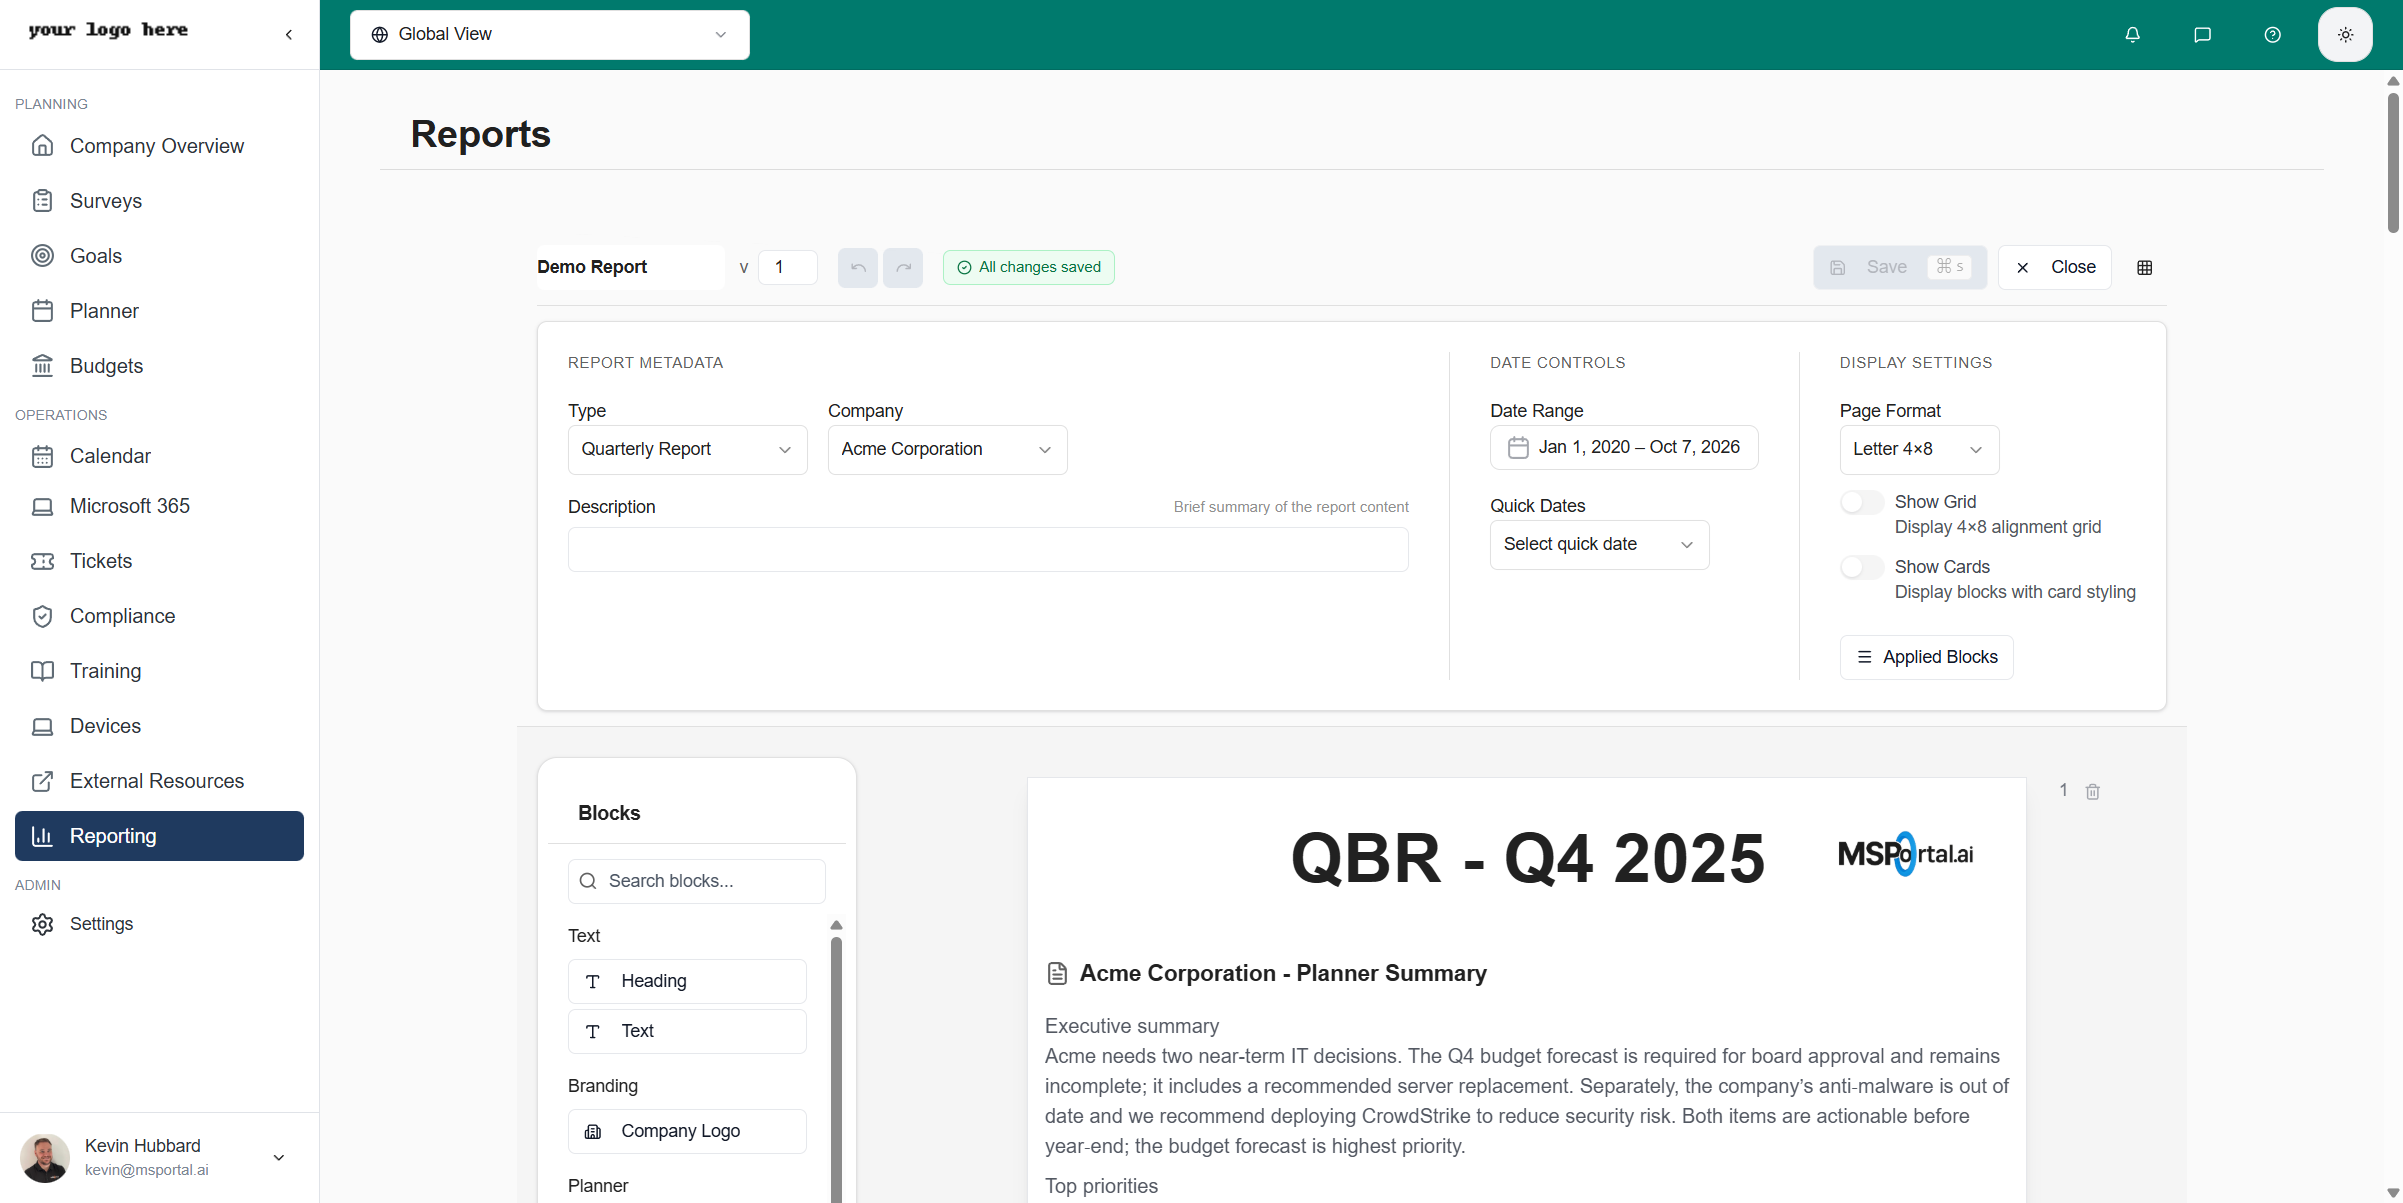
Report Metadata
Configure basic report information:| Field | Description |
|---|---|
| Report Title | Editable report name |
| Version | Version number for tracking changes |
| Type | Category (Quarterly Report, Monthly Summary, etc.) |
| Company | Associated company for data filtering |
| Description | Brief summary of report contents |
Date Controls
| Field | Description |
|---|---|
| Date Range | Start and end dates for data |
| Quick Dates | Preset ranges (This Quarter, Last Month, YTD) |
Display Settings
| Setting | Description |
|---|---|
| Page Format | Letter 4x8, A4, or custom layouts |
| Show Grid | Display alignment grid for positioning |
| Show Cards | Enable card styling on blocks |
| Applied Blocks | View list of blocks used in report |
Content Blocks
Text Blocks
| Block | Description |
|---|---|
| Heading | Large title text for sections |
| Text | Paragraph text with rich formatting |
Branding
| Block | Description |
|---|---|
| Company Logo | Insert your organization’s logo |
Planner Blocks
| Block | Description |
|---|---|
| Roadmap Timeline | Visual timeline of planned items |
| Planner Table | Table view of planner tasks |
| Planner Summary | AI-generated executive summary |
| Quarterly Roadmap | Planner items grouped by fiscal year and quarter, sized to fit any grid from 2x2 to 4x8 |
Quarterly Roadmap
A roadmap-style block that groups planner items by fiscal year and quarter, ready for QBR slides and client-facing PDFs.| Setting | Description |
|---|---|
| Columns | Show recommendation, description, type, status, priority, and value, in any combination |
| Filters | Filter by year, quarter, type, status, or priority. Useful for splitting “this year’s plan” from “completed work”, or excluding cancelled items |
| Density | Pick a text size (extra small, small, base, or large) so the same block fits compact at 2x2 or full-detail at 4x8 |
| Pagination | Split the block across multiple pages with offset and limit settings, useful for client-ready PDF exports of long roadmaps |
Compliance Blocks
| Block | Description |
|---|---|
| Compliance Score Overview | Overall compliance grade and metrics |
| Compliance Breakdown | Score by compliance group |
| Compliance Progress Over Time | Historical compliance trend chart |
| Non-Compliance Items List | Detailed list of failing checks |
| Compliance Report | Full compliance summary |
Goals Blocks
| Block | Description |
|---|---|
| Goals | Company goals with progress bars |
Budget Blocks
| Block | Description |
|---|---|
| Budget Detail | Full budget breakdown with line items |
| Budget Forecast | Multi-year budget projection chart |
Device Blocks
| Block | Description |
|---|---|
| Device Warranties | Warranty status summary |
| Device Inventory | Device list and counts |
| Warranty Timeline | Upcoming warranty expirations |
User Coverage Blocks
| Block | Description |
|---|---|
| Users List | Lists every user across the tenant alongside the systems each one shows up in (M365, PSA, MSPortal client portal) |
Users List
A coverage matrix that exposes which systems each user is present in. Useful for finding M365 licenses without a PSA contact, PSA contacts without portal access, or any other coverage gap.| Setting | Description |
|---|---|
| Filter mode | Show every user, only users with M365, only users with a PSA contact, only portal users, or only users with both M365 and a PSA contact |
| Active-only toggle | Hide disabled or terminated users with one click, so coverage reports don’t include people who have already left |
| Column visibility | Toggle each system column on or off so the same block doubles as a slim “who has portal access” list or a wide “full coverage matrix” |
Working with Pages
Page Management
- Add Page - Click ”+ Add Page” to create new pages
- Delete Page - Click the trash icon on a page header
- Page Numbers - Pages are numbered automatically
Block Positioning
- Drag and Drop - Move blocks to position them
- Resize - Drag block edges to resize
- Grid Alignment - Enable grid for precise positioning
- Split Across Pages - Large blocks can span multiple pages
Report Actions
Saving Reports
- Auto-save - Changes save automatically
- Manual Save - Press Ctrl+S or click Save
- Version Tracking - Version numbers track changes
Exporting Reports
Sharing Reports
- PDF Export - Share as professional PDF documents
- Direct Link - Share report URL with team members
- Meeting Integration - Add reports to meeting agendas
Report Types
| Type | Use Case |
|---|---|
| Quarterly Report (QBR) | Quarterly business reviews with clients |
| Monthly Summary | Regular status updates |
| Compliance Report | Audit and compliance documentation |
| Budget Review | Financial planning and tracking |
| Custom | Any specialized reporting need |
Best Practices
Report Design
- Start with Purpose - Define what the report should communicate
- Use Summaries - Include AI-generated executive summaries
- Balance Content - Mix charts, tables, and text
- Logical Flow - Organize from overview to details
Data Freshness
- Reports pull live data when viewed
- Export PDFs to capture point-in-time snapshots
- Set appropriate date ranges for the reporting period
Branding
- Upload company logo in Tenant Settings
- Logo appears automatically in report headers
- Consistent branding across all exported PDFs
Troubleshooting
Blocks Not Loading
- Verify the company has data for the selected date range
- Check that integrations are connected and synced
- Refresh the page and try again
Export Issues
- Ensure all blocks have finished loading
- Try a smaller date range for large reports
- Check browser pop-up settings for downloads
Missing Data
- Verify date range includes relevant data
- Check company selection matches data source
- Ensure required modules are enabled
Related Resources
- Company Overview - Dashboard metrics
- Compliance - Compliance data source
- Budgets - Budget data source
- Goals - Goals data source
- Planner - Planner data source