Accessing Company Audit

Summary Cards
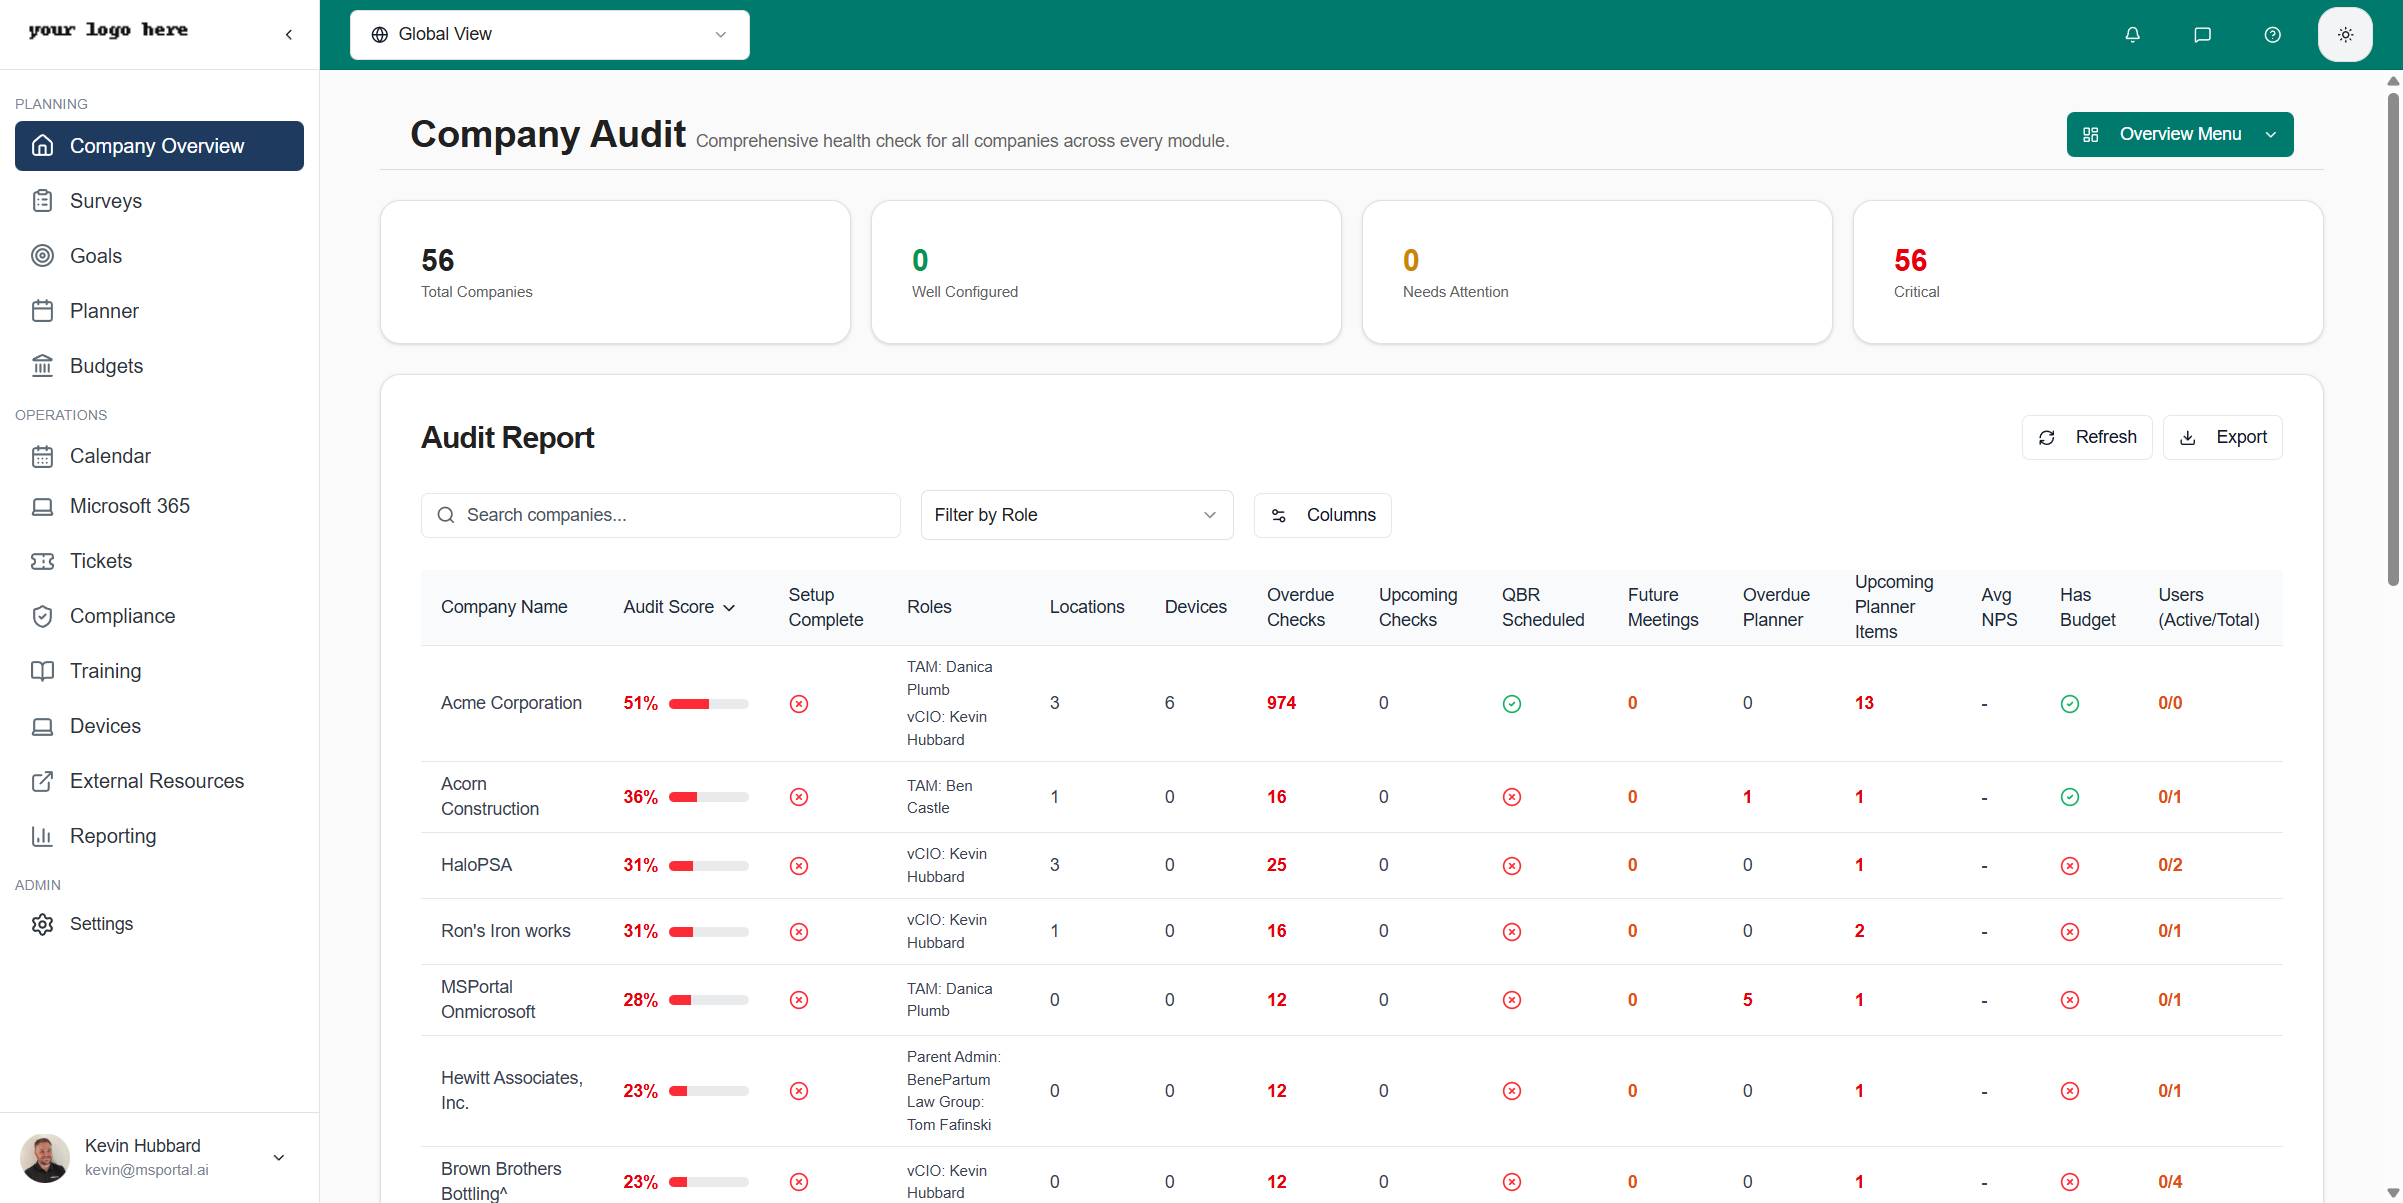
At the top of the page, four summary cards provide an instant overview of company health:| Card | Description |
|---|---|
| Total Companies | The total number of companies in your tenant |
| Well Configured | Companies with an audit score of 80% or higher (shown in green) |
| Needs Attention | Companies with an audit score between 60-79% (shown in yellow) |
| Critical | Companies with an audit score below 60% (shown in red) |
Understanding Audit Scores
The audit score is calculated based on multiple factors that indicate how well a company is configured in MSPortal.ai:| Factor | Points |
|---|---|
| Company roles assigned | 10 |
| QBR schedule configured | 10 |
| Users linked | 8 |
| Locations configured | 8 |
| Devices tracked | 8 |
| Upcoming planner items | 5 |
| Upcoming compliance checks | 5 |
| Budget configured | 5 |
| Integrations active | 5 |
A higher score indicates better configuration. Scores are displayed with color-coded progress bars: green (80%+), yellow (60-79%), and red (below 60%).
Audit Report Table
The main audit report displays all companies with configurable columns showing key metrics across every module.Default Columns
| Column | Description |
|---|---|
| Company Name | The name of the company |
| Audit Score | Overall configuration health percentage |
| Setup Complete | Whether the company setup wizard has been completed |
| Roles | Assigned company roles (TAM, vCIO, etc.) |
| Locations | Number of configured locations |
| Devices | Total number of managed devices |
| Overdue Checks | Compliance checks past their due date (highlighted in red) |
| Upcoming Checks | Compliance checks due soon |
| QBR Scheduled | Whether a QBR schedule is configured |
| Future Meetings | Number of upcoming booked meetings |
| Overdue Planner | Planner items past their due date |
| Upcoming Planner Items | Planner items due soon |
| Avg NPS | Average Net Promoter Score from surveys |
| Has Budget | Whether a budget is configured |
| Users (Active/Total) | Count of active users vs total users |
Customizing Columns
Click the Columns button to show or hide columns based on your needs. Columns are organized into categories: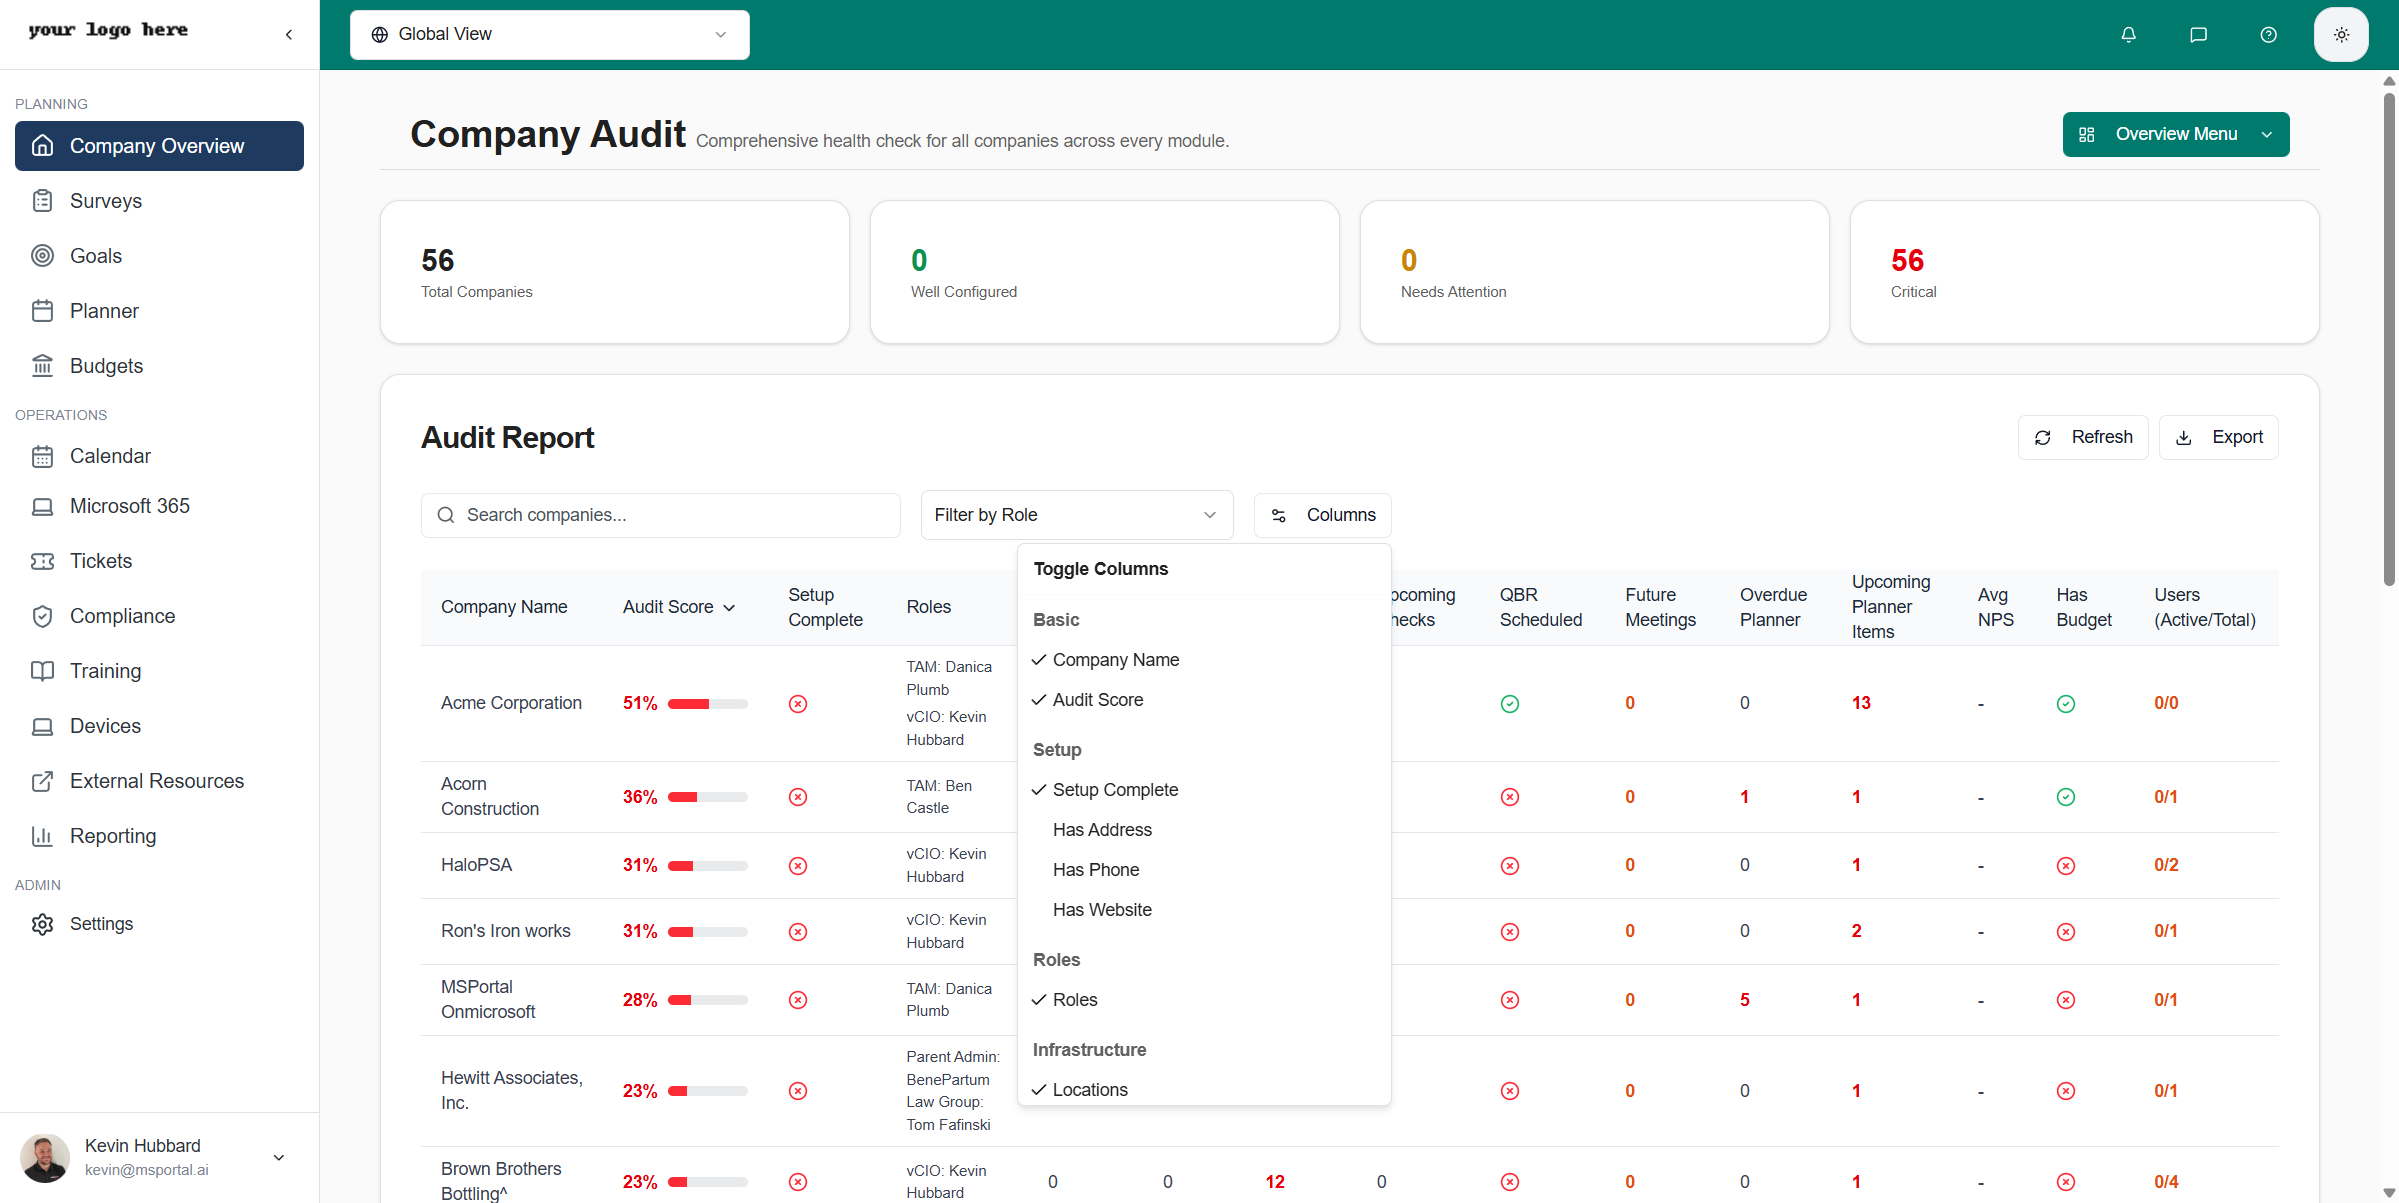
Basic
Basic
- Company Name
- Audit Score
Setup
Setup
- Setup Complete
- Has Address
- Has Phone
- Has Website
Infrastructure
Infrastructure
- Locations
- Devices
- Active Devices
Compliance
Compliance
- Total Checks
- Overdue Checks
- Upcoming Checks
- Last Compliance Run
QBR
QBR
- QBR Scheduled
- Next QBR
- Last QBR
Meetings
Meetings
- Upcoming Meetings
- Next Meeting
- Future Meetings
Planner
Planner
- Planner Items
- Overdue Planner
- In Progress
- Upcoming Planner Items
Goals
Goals
- Total Goals
- Incomplete Goals
- High Priority Goals
Surveys
Surveys
- Total Surveys
- Completed Surveys
- Last Survey
- Avg NPS
Budget
Budget
- Has Budget
- Budget Categories
- Total Budget
Users
Users
- Users (Active/Total)
- Total Users
- Active Users
Integrations
Integrations
- Integrations
- Active Integrations
Metadata
Metadata
- Created
- Last Activity
Filtering and Sorting
Search
Use the search box to filter companies by name. Type any part of the company name to instantly filter the results.Filter by Role
Use the Filter by Role dropdown to show only companies where a specific person is assigned to a role. This is useful for:- Viewing all companies managed by a specific TAM
- Seeing which companies a vCIO is responsible for
- Checking workload distribution across team members
Sorting
Click any column header to sort the table by that column. Click again to toggle between ascending and descending order. A sort indicator arrow shows the current sort direction.Actions
Refresh Data
Click the Refresh button to reload the audit data with the latest information from the database.Export to CSV
Click the Export button to download the current view (including any active filters) as a CSV file. The export includes all visible columns based on your column preferences.Best Practices
Weekly Audit Review
Weekly Audit Review
Review the Company Audit weekly to identify companies that need attention. Focus on:
- Companies with low audit scores
- Companies missing QBR schedules
- Companies with no assigned roles
Role Assignment
Role Assignment
Ensure all companies have TAM and vCIO roles assigned. Filter by role to verify workload distribution across your team.
Configuration Completeness
Configuration Completeness
Enable additional columns like “Has Address”, “Has Phone”, and “Has Website” to identify companies with incomplete basic information.
Export for Reporting
Export for Reporting
Use the Export feature to create periodic reports on company health. Filter by specific criteria before exporting to create targeted reports.
Troubleshooting
Why is a company showing a low audit score?
Why is a company showing a low audit score?
Review the company’s configuration across all modules. Common issues include:
- No roles assigned to the company
- Missing QBR schedule
- No upcoming compliance checks scheduled
- Zero devices or locations configured
- No budget items set up
How often is the audit data updated?
How often is the audit data updated?
The audit data is refreshed when the page loads. Click the Refresh button to get the latest data at any time.
Why can't I see certain columns?
Why can't I see certain columns?
Use the Columns button to enable additional columns. Some columns are hidden by default to keep the view manageable.
Related Resources
Company Overview
Return to the main Company Overview dashboard
Compliance
Manage compliance checks and frameworks
Planner
Create and track roadmap items
Settings: Companies
Configure company settings and roles