

Before you start
- You need Planner read access.
- Open Planner Menu > Analytics and set the company selector, Currency, Cost type and period first. Every panel uses that filtered data. See Read and export Planner Analytics.
- Use the Dashboard and Pipeline tabs in the page header to switch between panels. Switching tabs does not change any item.
Dashboard and Pipeline use the same Analytics filters.
Dashboard: Project Health Score
Overall Health combines four measures and leaves out Cancelled work.
The gauge shows Healthy at 75% or above, At Risk from 50% to below 75%, and Critical below 50%. These are planning indicators. They are not a service-level or compliance rating.
An item is overdue when its due date is before today and its status is not Completed or Cancelled.
The Healthy, At Risk and Critical item buttons use item rules. Completed is Healthy. Overdue, On Hold or probability below 30% is Critical. Otherwise a probability of 60% or more is Healthy and the rest are At Risk. The Overdue button narrows to overdue items. Clicking a button filters the analysis.
The Completion Rate inside this panel is a plain count. The headline Completion Rate is weighted by Business Value, so the two can differ.
Dashboard: Risk Matrix
The Risk Matrix leaves out Completed and Cancelled work. High impact means High or Medium Business Value, or a cost above 10,000 in the selected currency and cost type.
Click a quadrant to filter the analysis. A missing probability counts as 50%.
A Risk Matrix category is not the same as a Project Health category. Overdue work can be Critical for health and still sit in Opportunity because of its probability and impact.
Dashboard: expected value and High Risk Items
EV by Status and EV by Quarter compare the Expected amount (cost times probability) with the Planned cost. Completed work counts its full cost and Cancelled work is left out. Click a bar to filter by that status or quarter. Quarters are calendar quarters of an item’s due date, or of its start date when it has no due date. Items with neither date appear in Unscheduled, including their costs and hours. Click that bucket to analyze the same undated work. High Risk Items lists up to five unfinished items that have a cost above zero, ranked by cost times (1 minus probability). This is different from the Risk Matrix quadrants. Click an item to narrow Analytics to it. Use List View to open and edit it.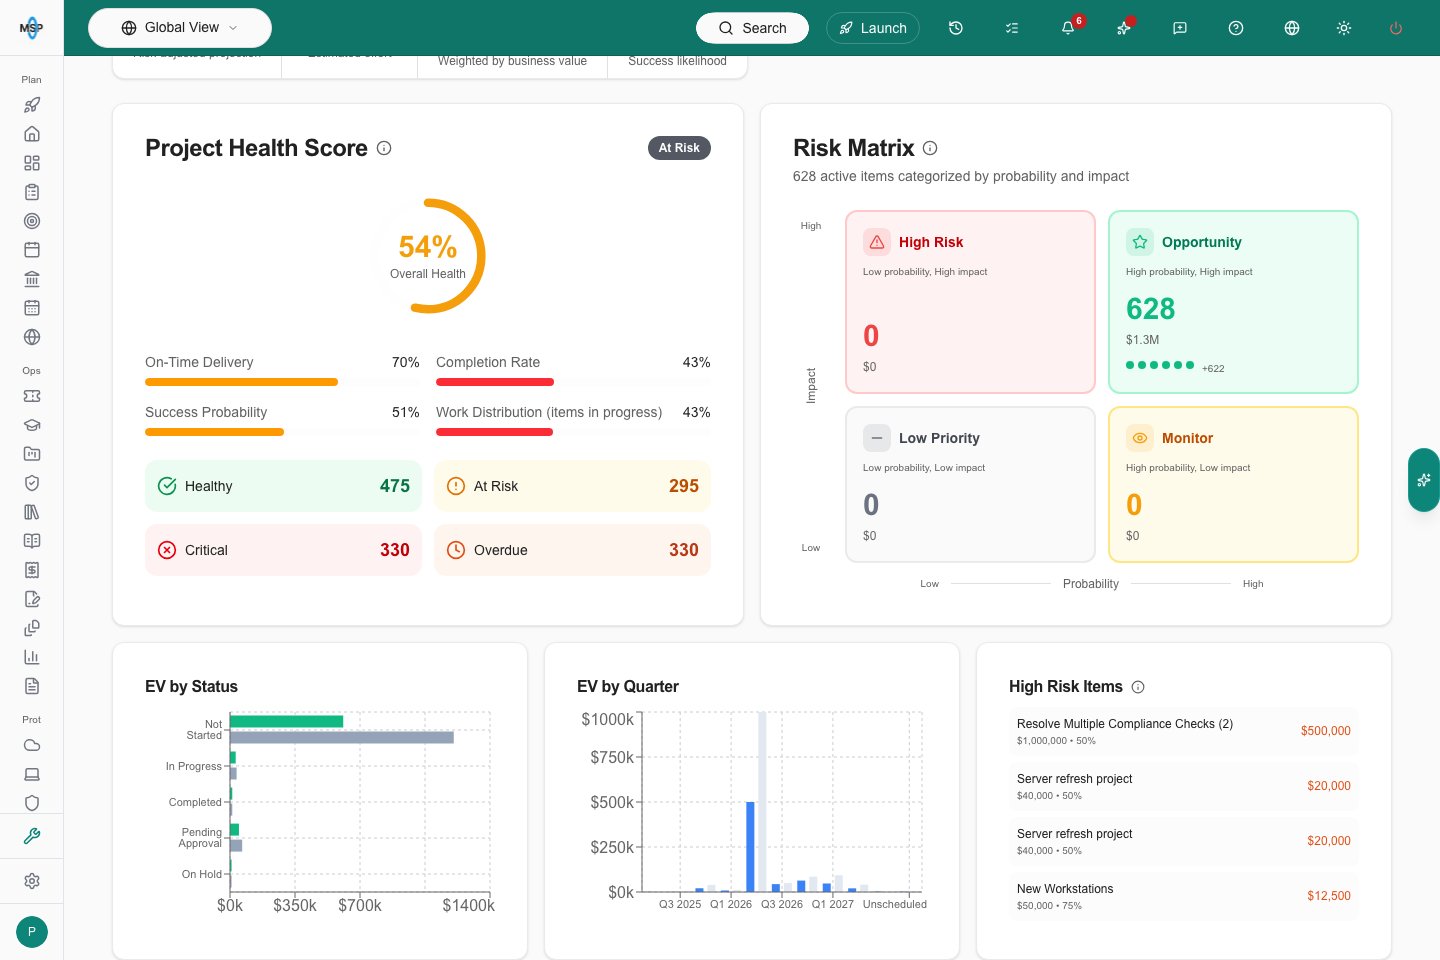
Undated work has an Unscheduled bucket in EV by Quarter.
Pipeline: status and resources
Status Pipeline groups non-cancelled work into Not Started, Pending Approval, In Progress and Completed. Other statuses such as On Hold show separately as Other Statuses. Click a stage to narrow the analysis. The arrows show status order. They are not historical conversion rates. Its Completion Rate is the plain share of non-cancelled work that is Completed. Blocked Items counts On Hold items. Stage values and hours use the selected cost type and estimated effort. Resource Allocation is a heatmap of estimated hours by quarter and status, leaving out Cancelled work. Darker cells hold more hours compared with the largest cell in the filtered chart. It does not show technician availability or a capacity limit. Click a cell to filter by its quarter and status. No hours allocated to display means the matching work has zero estimated hours.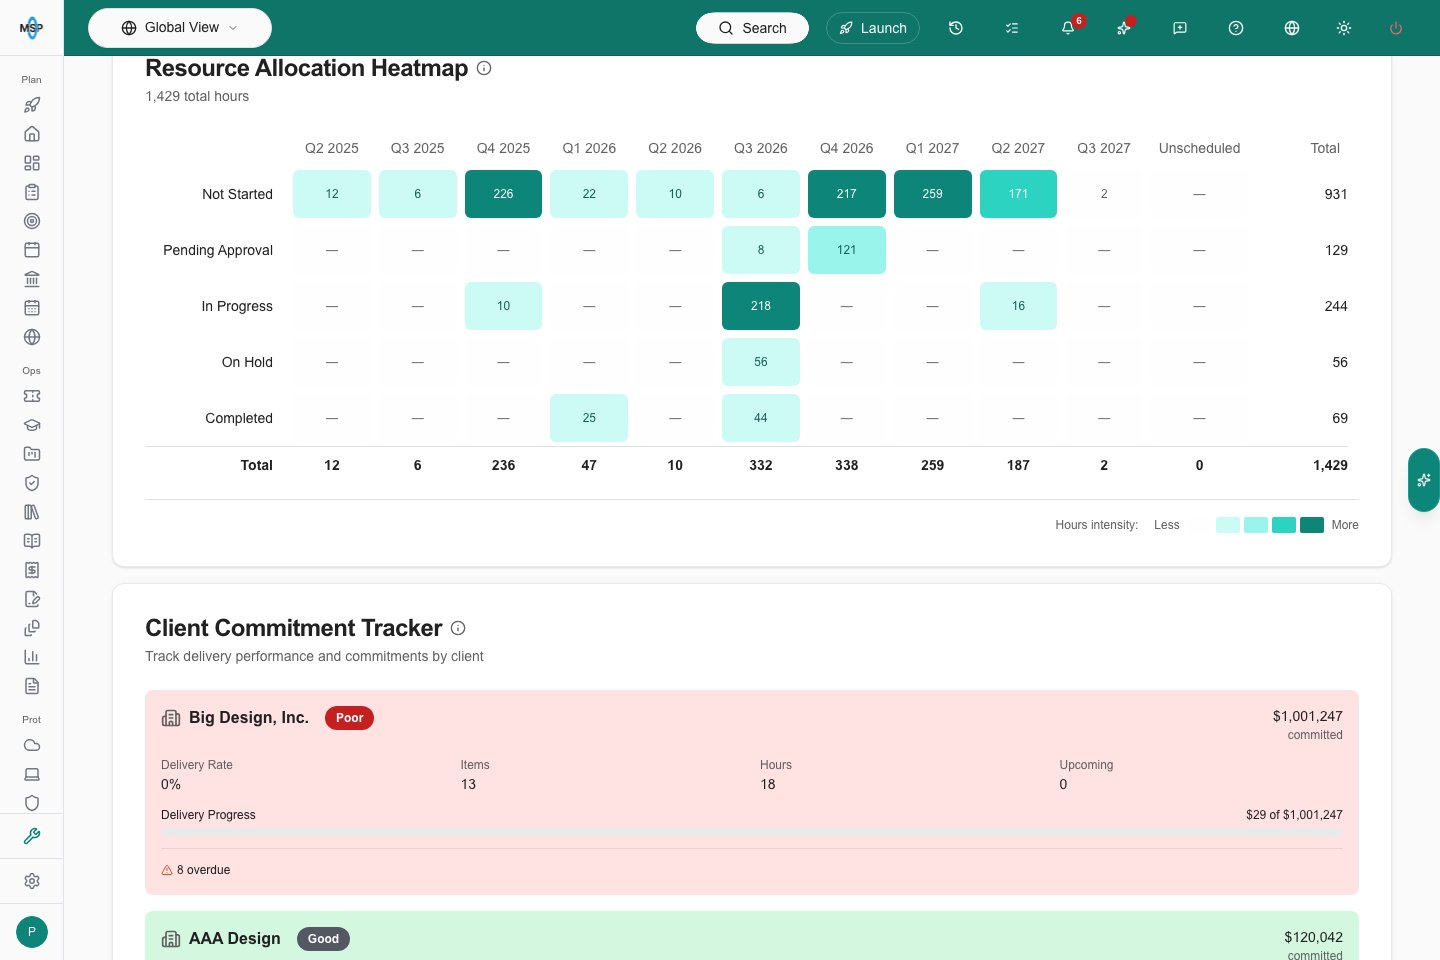
Resource Allocation separates Unscheduled from calendar quarters.
Pipeline: Client Commitment Tracker
This panel leaves out Cancelled work, then groups the filtered work by company and shows up to ten companies, ordered by cost in the selected cost type.- Committed is the sum of that company’s non-cancelled Planner estimates. It does not mean the client approved anything or signed a commitment.
- Delivered is the cost of Completed items. Delivery Rate is Delivered divided by Committed, or zero when Committed is zero.
- Upcoming counts unfinished, non-cancelled items due in the next 30 days.
- Click a company card to narrow Analytics to that company.
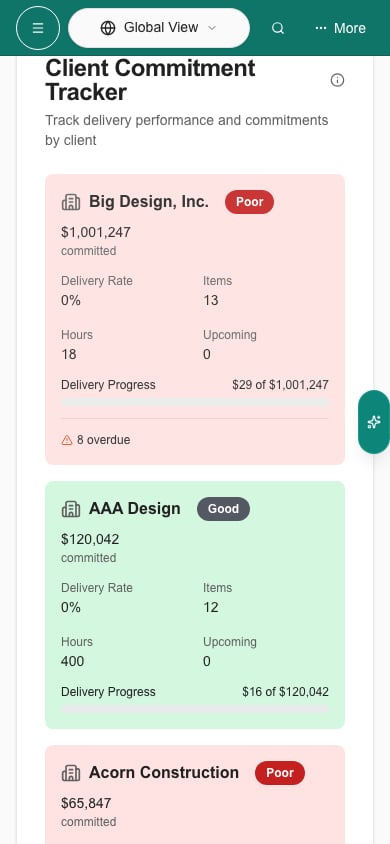
Client names, health badges and committed amounts fit on phones.
Clear a chart selection
Click Clear in the toolbar to remove the chart selection and keep your other filters. If a selection matches nothing, click Clear Filter. A new chart selection replaces the old one. Nothing is saved as a report, and the underlying work does not change.Troubleshooting
Frequently asked questions
Is Project Health Score the same as the headline Completion Rate?
Is Project Health Score the same as the headline Completion Rate?
No. Health combines four measures and uses a plain completion count. The headline rate is weighted by Business Value.
What makes an item Critical in the health panel?
What makes an item Critical in the health panel?
Being unfinished and overdue, On Hold or below 30% probability. Completed items are Healthy.
What is the Risk Matrix probability boundary?
What is the Risk Matrix probability boundary?
Below 50% is low probability. 50% or above is high probability.
Does High Risk Items list every High Risk quadrant item?
Does High Risk Items list every High Risk quadrant item?
No. It lists up to five unfinished items with a cost, ranked by cost times (1 minus probability).
Does clicking a High Risk Items title open the editor?
Does clicking a High Risk Items title open the editor?
No. It narrows Analytics to that item. Open it from List View.
Do the pipeline arrows show historical conversion?
Do the pipeline arrows show historical conversion?
No. They show the current spread of work by status.
Does Resource Allocation show technician capacity?
Does Resource Allocation show technician capacity?
No. It groups estimated Planner hours by quarter and status.
Does Committed mean the client approved the amount?
Does Committed mean the client approved the amount?
No. It sums Planner estimates for that company.
Is the Good, Fair or Poor badge the Overall Health gauge?
Is the Good, Fair or Poor badge the Overall Health gauge?
No. The badge uses overdue items, low-probability work and delivery rate.